
Last Updated on September 30, 2026
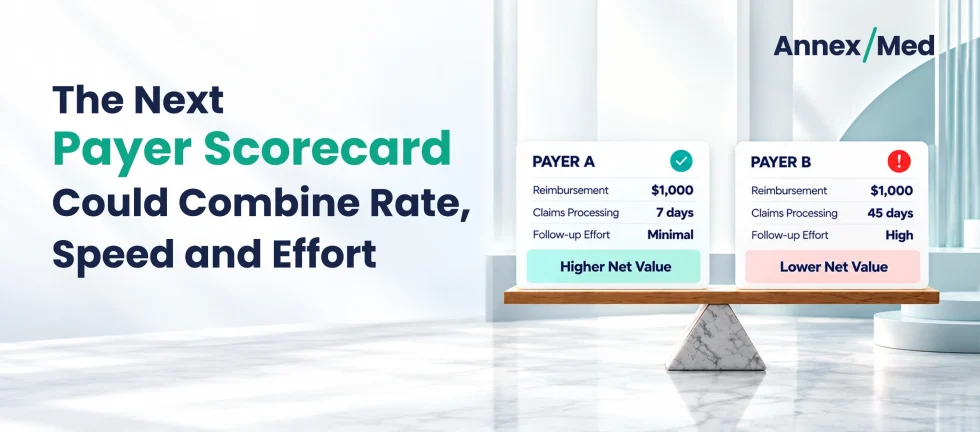
Two payers can reimburse the same amount for the same type of claim and still create very different financial outcomes for a healthcare organization.
Consider two hypothetical payers.
Payer A reimburses $1,000, processes the claim in seven days, and requires minimal follow-up.
Payer B also reimburses $1,000 but takes 45 days to process the claim and requires repeated intervention from the revenue cycle team.
Looking only at reimbursement, the two payers appear equal. Operationally, they are not.
The difference lies in what happens between claim submission and collected revenue. Processing delays, denials, documentation requests, underpayments, appeals, and repeated follow-up all consume revenue cycle capacity.
For CFOs and revenue cycle leaders, this raises a more useful question:
Should payer performance be measured by reimbursement rate alone?
Or
Should the scorecard also account for how quickly payment arrives, how accurately claims are paid, and how much operational work is required to collect it?
Table of contents
Why Reimbursement Rate Is Only Part of Payer Performance
Contracted reimbursement remains fundamental to payer evaluation. Healthcare organizations need to know whether payments align with negotiated rates and whether contracts are producing the expected financial return.
However, contracted reimbursement is not the same as realized reimbursement. A payer may have attractive negotiated rates but produce lower realized value when claims are denied, underpaid, delayed, or written off. Conversely, a payer with a lower nominal rate may deliver stronger realized value if claims are paid accurately and predictably with limited intervention.
The reimbursement rate alone does not show what it takes to collect payment. A payer relationship may introduce:
- Longer adjudication cycles.
- Higher denial volumes.
- Repeated documentation requests.
- More appeals.
- Underpayment investigations.
- Frequent claim-status follow-up.
- Authorization-related rework.
- Manual payer intervention.
Every additional touch can consume staff capacity and extend the time between service delivery and cash realization.
The goal is not to attribute every difficult claim to payer behavior. Administrative work may arise from payer processing, provider documentation, coding, authorization, eligibility, clearinghouse edits, or internal workflow design. A useful payer scorecard separates payer-driven friction from provider-controlled rework so leaders can identify the right response.
This is why payer evaluation should connect contract performance with revenue cycle operations.
AnnexMed’s Payer and Contract Analytics brings together carrier-level financial performance, administrative cost, contract compliance, and payer portfolio intelligence rather than looking at collections alone.
What a Modern Payer Scorecard Should Measure
A more useful payer scorecard brings four dimensions together: rate, speed, effort, and reliability.
| Dimension | Example Measures | What It Shows |
|---|---|---|
| Rate | Allowed-to-expected ratio, payment accuracy, underpayment variance | Whether payment aligns with contract expectations |
| Speed | Days to first payment, adjudication time, A/R aging | How quickly payment becomes cash |
| Effort | Claim touches, appeals, documentation requests, authorization rework | Work required to collect payment |
| Reliability | Initial denial rate, repeat denials, payment variance | Consistency of adjudication |
HFMA payer-scorecard guidance includes clean-claim performance, prompt payment, average days to first payment, denial-resolution time, A/R aging, allowed-to-expected ratios, and reimbursement velocity.
AnnexMed Observation
Payer performance becomes more actionable when reimbursement is viewed alongside the operational work required to collect it. A payer that ultimately pays the expected amount may still create significant revenue-cycle friction if claims regularly require manual intervention.
Rate
Rate answers:
What is the organization being paid?
Measures may include:
- Allowed-to-expected ratio.
- Payment accuracy.
- Contractual variance.
- Underpayment rate.
- Payment variance by claim line.
- Reimbursement by CPT, DRG, APC, or service line.
- Denial write-offs by payer.
Rate comparisons should be segmented where possible. Comparing average reimbursement across unrelated service lines, sites of service, or case mixes can produce misleading conclusions.
AnnexMed’s Payer Contract Management model evaluates payment accuracy, denial rates, underpayment patterns, and remittance-to-contract variance at the payer level.
Speed
Speed asks:
How efficiently does expected reimbursement become collected cash?
Useful measures can include:
- Days from service to claim submission.
- Days from submission to adjudication.
- Days to first payment.
- Days from denial to appeal.
- Days from appeal to resolution.
- Percentage of A/R over 90 days.
- Payment delays by payer.
- Payment velocity by claim value.
Break total time to payment into separate intervals. Charge capture, claim submission, payer adjudication, denial resolution, and payment posting should be measured separately so internal delays are not incorrectly attributed to payer performance.
A payer may ultimately reimburse the contracted amount while still creating cash-flow pressure through consistently slow adjudication.
AnnexMed’s Accounts Receivable Management Services incorporate payer-specific follow-up, A/R intelligence, aging visibility, and payer behavior into account prioritization.
Effort
Effort asks the question that standard payer reports often miss:
How much work does the revenue cycle team perform to collect the payment?
Potential measures include:
- Average touches per adjudicated claim.
- Percentage of claims requiring intervention.
- Staff minutes per claim.
- Follow-up frequency.
- Documentation requests per 1,000 claims.
- Appeals per 1,000 claims.
- Authorization rework rate.
- Underpayment investigations per 1,000 paid claims.
- Manual status checks.
- Cost to collect by payer.
A “touch” should be defined consistently. A portal check, phone call, corrected claim, documentation upload, appeal, authorization rework, underpayment investigation, and internal escalation should be counted through a common taxonomy. Without a shared definition, payer comparisons may reflect workflow differences instead of actual payer friction.
Why Administrative Effort Changes Payer Value
Follow-up is not free. Every payer call, portal check, corrected claim, appeal, documentation submission, and underpayment investigation uses revenue cycle resources. A high-effort payer can contribute to:
- Higher A/R workload.
- Slower cash conversion.
- Greater staffing pressure.
- Higher cost to collect.
- Less capacity for complex accounts.
For revenue cycle leadership, the question therefore changes from:
What does this payer reimburse?
to:
What does it take to collect that reimbursement?
The financial impact of effort depends on claim value, staffing cost, payer mix, service-line complexity, and the organization’s internal workflow. That is why effort should be measured alongside rate and speed rather than treated as a standalone payer problem.
Segment Payer Performance to Find the Real Problem
Enterprise averages can hide important differences. A payer may perform adequately overall but create friction for a specific specialty, location, procedure category, or claim type. Segment payer performance by:
- Payer and line of business.
- Facility or location.
- Specialty.
- Service line.
- Procedure category.
- Professional, facility, emergency, observation, surgical, or other claim type.
- Claim value.
- Denial reason.
- Aging bucket.
- Provider group.
A high denial rate shows that something requires attention. A high authorization-denial rate concentrated within one payer, payer product, and service line identifies where to investigate.
Denial analysis should also distinguish payer behavior from provider-controlled causes such as eligibility, authorization, coding, documentation, timely filing, and claim-format errors.
The HFMA Claim Integrity Task Force recommends consistent measures including initial denial rate by volume and dollars, denial write-offs, time from denial to appeal, time from denial to resolution, and the percentage of initial denials overturned.
A paid claim is not necessarily a correctly paid claim. Compare actual reimbursement with the expected allowed amount, contract terms, modifiers, units, site of service, and applicable reimbursement rules.
AnnexMed’s Underpayment Analysis and Recovery Services compare actual reimbursement against payer contract terms to identify and investigate payment variance.
Turn Payer Scorecards Into Revenue Cycle Decisions
The value of payer intelligence comes from what leadership can do with it.
A payer with strong reimbursement but slow payment may require closer A/R management. A payer generating repeated documentation requests may expose an upstream documentation or claim-submission issue.
Persistent underpayments may require contract validation and payer escalation. High denial and appeal effort may justify root-cause analysis by payer, procedure, provider, location, or denial category. A payer requiring repeated manual follow-up may need different work-queue prioritization than one with predictable adjudication behavior.
A practical implementation process includes:
- Define claim-level and dollar-level metrics consistently.
- Set the measurement period and minimum sample size.
- Separate payer products and lines of business.
- Segment by specialty, facility, procedure, and claim type.
- Separate payer-driven friction from provider-controlled rework.
- Compare actual reimbursement with expected reimbursement.
- Track claim touches and interventions consistently.
- Review trends monthly and investigate meaningful outliers.
- Assign owners and deadlines to improvement actions.
- Use findings during payer escalation and contract renewal.
This is where the payer scorecard moves beyond reporting. It becomes a decision-support tool for A/R prioritization, denial prevention, underpayment recovery, contract-performance analysis, staffing allocation, payer escalation, and contract-renewal preparation.
AnnexMed’s broader Revenue Cycle Management Services connect A/R follow-up, denial management, underpayment identification, payment reconciliation, and front-end revenue workflows.
From Payer Rate to Payer Value
A payer scorecard should answer more than:
How much did this payer reimburse?
It should show:
- Rate: What financial value is being returned?
- Speed: How quickly does that value become collected cash?
- Effort: How much operational capacity is required to collect it?
- Reliability: How consistently are claims adjudicated as expected?
Bringing these dimensions together creates a more complete view of payer performance.
AnnexMed connects payer and contract analytics with A/R management, denial prevention, underpayment recovery, payment reconciliation, and revenue-cycle reporting. This helps healthcare organizations move beyond carrier-level collections reporting and examine the difference between contracted reimbursement and realized payer value.
Measure what payers reimburse and what it takes to collect it.
Turn payer data into revenue-cycle action
AnnexMed helps finance and RCM leaders use payer-specific analytics to prioritize A/R, identify recurring denial causes, investigate underpayments, and prepare for payer discussions.
Talk to UsFAQs
A payer scorecard evaluates payer performance across reimbursement, payment speed, denials, underpayments, and administrative effort.
Track reimbursement accuracy, days to payment, denial rates, A/R aging, underpayments, claim touches, and follow-up effort.
Similar reimbursements can require very different levels of follow-up. Measuring effort reveals the operational cost behind collecting revenue.
They identify payers and claim categories causing slower payments or repeated follow-up, helping teams prioritize A/R more effectively.
They expose recurring denial patterns by payer, reason, specialty, or service line so teams can target root causes upstream.