
Last Updated on September 3, 2026
Looking for a Partner That Delivers More Than Denial Management?
AnnexMed combines denial analytics, operational expertise, and revenue cycle optimization to help healthcare organizations improve reimbursement accuracy and long-term financial performance.
Talk to UsRevenue leaders rarely discover financial problems overnight.
Cash flow doesn’t suddenly slow. Margins don’t tighten without warning. Denials don’t increase unexpectedly.
Before reimbursement performance changes, the revenue cycle leaves measurable signals. The challenge is not collecting more reports. It’s knowing which denial KPIs deserve executive attention before those signals become financial losses.
Most healthcare organizations monitor denial volume. High-performing revenue cycle teams monitor the metrics that explain why denials are increasing, where revenue is leaking, how quickly issues are being resolved, and what those trends mean for financial performance.
In this article, we’ll explore the denial KPIs every healthcare revenue leader should monitor, what each metric reveals, and how these insights help improve denial management, reimbursement accuracy, and revenue cycle performance.
Table of contents
The Benchmarks High-Performing Hospitals Achieve in 2026
Why Denial KPIs Matter More Than Denial Counts
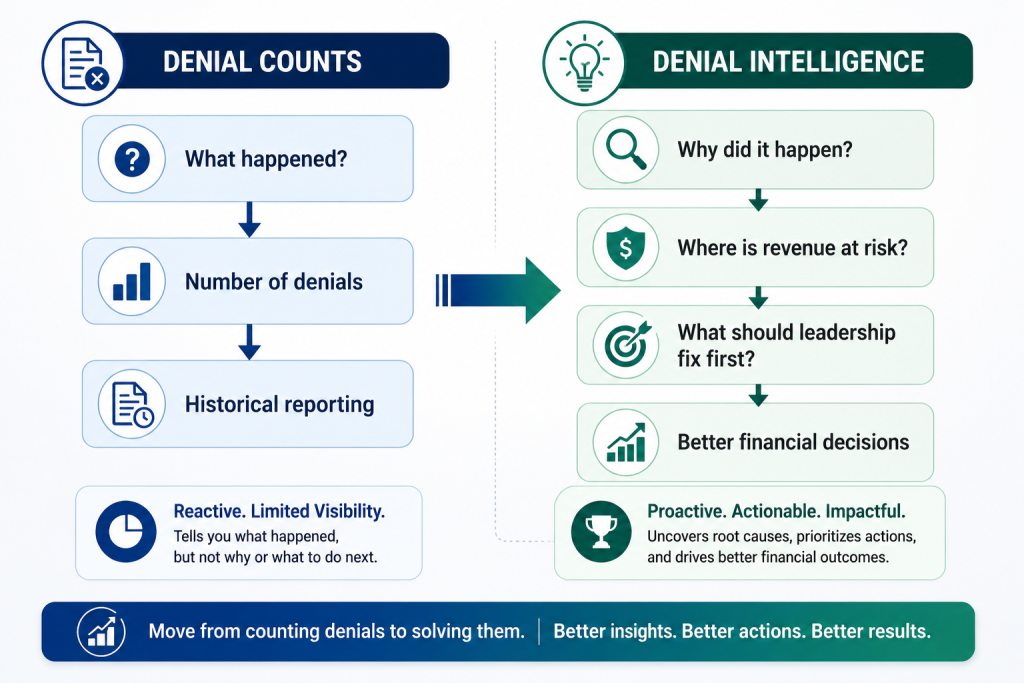
A denial report tells you what happened. A denial KPI tells you why it happened.
That difference is significant.
Looking only at denial volume is similar to seeing a warning light on a dashboard without understanding what triggered it. Revenue leaders need metrics that reveal operational trends before they affect reimbursement, accounts receivable, and cash flow.
The right denial KPIs help answer questions and these questions form the foundation of an executive denial management dashboard.
The transformation from denial counts to denial intelligence is where meaningful improvement begins
1. Are Denials Increasing?
KPI: Overall Denial Rate
The overall denial rate measures the percentage of submitted claims that payers deny. By itself, this KPI is an early warning signal rather than a diagnosis. A rising denial rate often indicates upstream issues involving patient access, eligibility verification, prior authorization, documentation, coding accuracy, or payer policy updates.
Revenue leaders should monitor:
- Monthly denial trends
- Denial rate by service line
- Denial rate by facility
- Denial rate by payer
Increasing denial rates rarely begin in the billing office. They usually reflect breakdowns earlier in the revenue cycle.
2. Where Are Denials Coming From?
KPI: Denial Reason Analysis
Knowing that denials increased is only the beginning. Understanding the source allows organizations to prioritize operational improvements. High-value denial categories include:
- Eligibility
- Prior Authorization
- Medical Necessity
- Coding
- Documentation
- Timely Filing
- Coordination of Benefits
Analyzing denial reasons alongside payer-specific trends provides much greater visibility than reviewing denial totals alone. Root cause analysis transforms denial reporting into actionable decision-making.
3. Which Denials Are Preventable?
KPI: Preventable Denial Rate
Not every denial is avoidable. However, many originate from workflow failures that can be corrected before claims are submitted. Preventable denials often result from:
- Missing authorizations
- Registration errors
- Coding inconsistencies
- Documentation gaps
- Missing modifiers
Reducing preventable denials improves reimbursement while lowering administrative workload. Every preventable denial represents revenue that could have been protected before billing.
4. How Long Do Denials Stay Open?
KPI: Average Denial Resolution Time
The longer denied claims remain unresolved, the greater their financial impact.
Long resolution cycles increase:
- Accounts receivable days
- Administrative costs
- Delayed reimbursement
- Risk of write-offs
Tracking denial aging by payer and denial category helps leadership identify workflow bottlenecks before they affect cash flow. Fast resolution protects liquidity. Long resolution cycles increase financial risk.
5. Are We Recovering Denials Efficiently?
KPI: Appeal Success Rate
Appeals play an important role in recovering earned revenue.
However, appeal performance should not be viewed independently.
A consistently high appeal success rate may indicate that many denials could have been prevented before submission.
Organizations should monitor:
- Appeal success percentage
- Average appeal turnaround time
- Revenue recovered through appeals
- Cost to rework denied claims
Recovery improves reimbursement. Prevention improves financial performance.
6. What Are Denials Really Costing?
KPI: Financial Impact of Denials
Denials affect far more than claim volume.
Their financial impact includes:
- Delayed cash collections
- Increased labor costs
- Revenue write-offs
- Opportunity cost
- Margin erosion
Leading healthcare organizations evaluate denied dollars, recovery rates, and write-off trends alongside traditional denial metrics. The true cost of denials extends well beyond the denied claim itself.
Are Your Denial KPIs Revealing the Right Signals?
Looking at denial volume alone rarely tells the full story. Discover where revenue is at risk with a structured denial performance assessment from AnnexMed.
Request a Denial KPI ReviewBuilding an Executive Denial Dashboard
High-performing healthcare organizations bring these KPIs together into a single executive dashboard. An effective denial management dashboard should include:
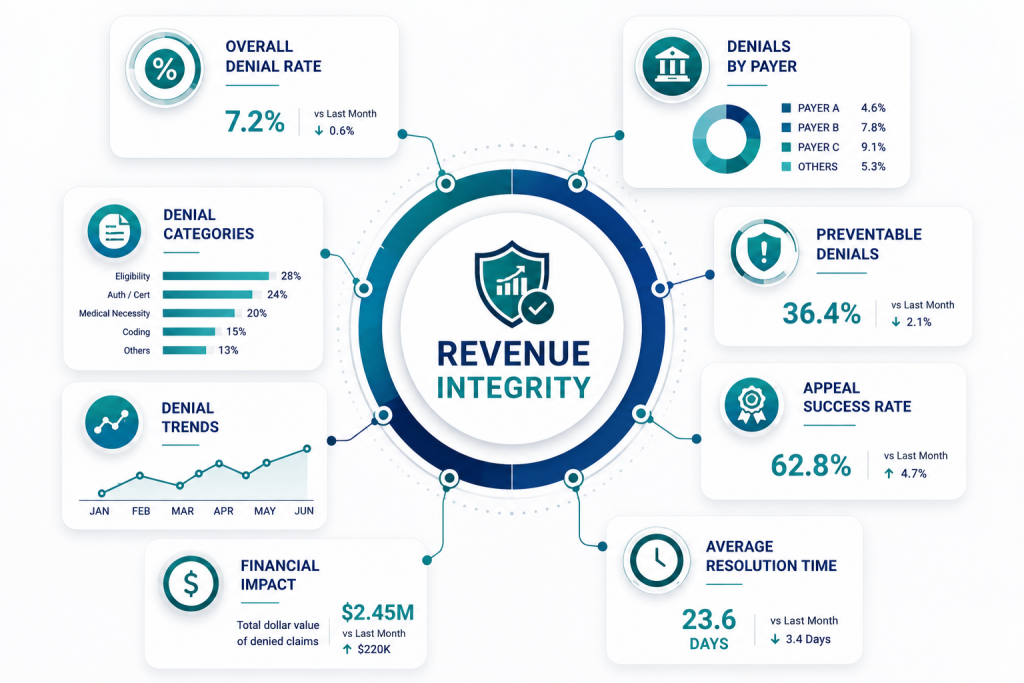
Viewed together, these metrics provide an early warning system for reimbursement performance and revenue cycle health.
Best Practices for Improving Denial KPIs
Organizations that consistently reduce denials focus on continuous operational improvement rather than reactive claim correction. Recommended practices include:
- Strengthen patient access and eligibility verification.
- Improve prior authorization workflows.
- Standardize clinical documentation and coding quality.
- Monitor payer-specific denial patterns.
- Conduct routine denial analytics and trend reviews.
- Review denial KPIs during executive revenue cycle meetings.
The objective is to identify patterns early and prevent revenue leakage before reimbursement is affected.
How AnnexMed Helps Healthcare Organizations Improve Denial Performance
Improving denial performance requires more than appeal management. AnnexMed applies a structured revenue cycle approach that addresses the operational drivers behind denials across patient access, coding, documentation, claim quality, payer compliance, denial analytics, and accounts receivable management.
By combining experienced revenue cycle professionals with data-driven reporting and workflow optimization, AnnexMed helps healthcare organizations reduce preventable denials, improve reimbursement accuracy, strengthen cash flow, and increase financial visibility.
Transform Denial Signals Into Stronger Financial Outcomes
Partner with AnnexMed to uncover root causes, strengthen reimbursement accuracy, reduce preventable denials, and build a healthier revenue cycle through data-driven operational improvements.
Schedule a MeetingFAQs
Denial KPIs are measurable performance indicators used to monitor claim denials, identify revenue risks, evaluate denial management performance, and improve reimbursement across the healthcare revenue cycle.
Overall denial rate is an important leading indicator, but organizations should also monitor denial reasons, preventable denials, appeal success rate, average resolution time, and financial impact to gain a complete view of revenue cycle performance.
Operational teams often review denial KPIs weekly, while executive leadership typically reviews trend-based denial dashboards monthly to identify strategic risks and prioritize improvement initiatives.
Denial KPIs help organizations identify workflow issues early, reduce preventable denials, improve reimbursement accuracy, shorten resolution times, and strengthen cash flow by reducing revenue leakage.
Healthcare organizations can reduce preventable claim denials by strengthening patient eligibility verification, prior authorization workflows, clinical documentation, coding accuracy, and claim quality before submission. Regular denial trend analysis and KPI monitoring also help identify recurring issues and support continuous revenue cycle improvement.
An executive denial management dashboard should provide visibility into overall denial rate, denial trends, denials by payer, denial categories, preventable denials, appeal success rate, average denial resolution time, and the financial impact of denied claims. Together, these KPIs help revenue leaders identify revenue risks early and make informed operational and financial decisions.